A Retail Sales Simulation Exploration
Given a set of simulated Excel sheet data for retail sales, let's see what we're about to find out about this particular retail environment in terms of products, sales and customers.
DATA RELATED
Ian Ng
4/15/20254 min read


The Data
Grabbed a set of simulated data from Kaggle, and here is a summary of the data itself.
Transaction ID, for each unique transaction made in the store;
Customer ID, for each unique customer who did a transaction;
Gender, male or female customers;
Age, purchasing customer's age;
Date, the date transaction was made;
Product Category, consisting of Beauty, Clothing and Electronics;
Quantity, quantity of products purchased;
Price per Unit, price per product unit;
Total Amount, total purchase amount;
Excel sheet is well-organised and properly aligned, without missing data. File type was already in .csv format, only have to make sure data columns were on point to import into MySQL Workbench.
This dataset features transactions made by customers throughout the year 2023.
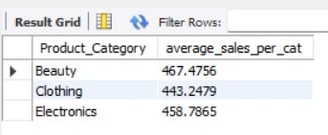
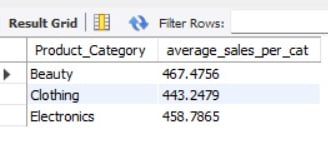
Let's say the average sales target is $450 per customer, let us check if our products hit that target:
SELECT Product_Category, AVG(Total_Amount) AS average_sales_per_cat
FROM retail_sales_dataset
GROUP BY Product_Category;
It looks like with the exception of Beauty category, we already hit our target with Clothing and Electronics.
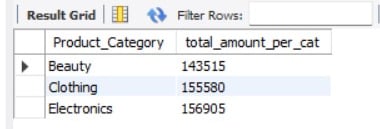
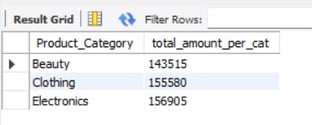
Now we are going to explore which product category sells the most in 2023:
SELECT Product_Category, SUM(Total_Amount) as total_amount_per_cat
FROM retail_sales_dataset
GROUP BY Product_Category;
And this gives us: Electronics
From here, we know that Electronics category sells the most, but it could also be due to a few customers placing a large order that bumps up the revenue for this category.
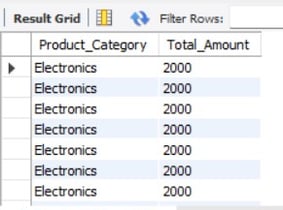
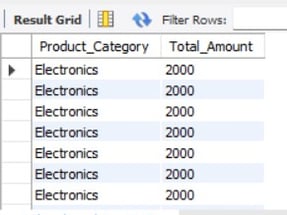
To find out if this is the case, we need to start looking at individual purchases for this category.
SELECT Product_Category, Total_Amount
FROM retail_sales_dataset
WHERE Product_Category = 'Electronics'
ORDER BY Total_Amount DESC LIMIT 100
;
A limit of up to 100 rows was applied to the query, and thousand dollars worth of purchases is far from the outlier in this dataset:
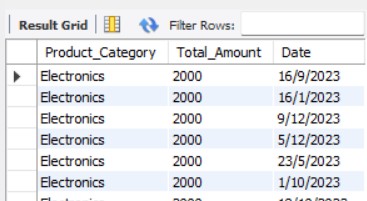
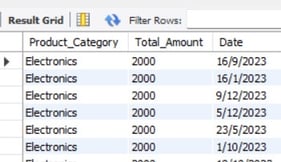
From here, we are going to check which quarter of the year, the product sells the most(if we determine that high sales is equal to or over $1500), so we can stock up accordingly to improve inventory turnaround for the store, which contributes to higher store sales.
SELECT Product_Category, Total_Amount, Date
FROM retail_sales_dataset
WHERE Product_Category = 'Electronics' AND Total_Amount >= '1500'
ORDER BY Total_Amount DESC LIMIT 100
;
33 rows, each a different date were returned, and after manually summing up the individual quarter sales of Electronics, the 2nd and 4th quarters have the most sales, in fact double the quarters that precede each of them. Therefore, the store should prepare to have double the inventories ready before the start of the 2nd and 4th quarter to manage customer demand.
What is the prominent profile of Male customers that walk into my store and make purchases? This can be how we start pushing different marketing strategy to cater to this group of customers.
With this in mind, I will need to query from a table that has only the information I wanted. From here I will be creating a CTE to filter and grab from the table of a thousand rows.
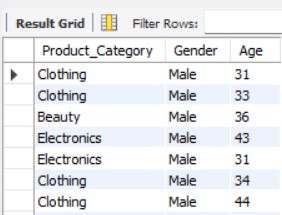
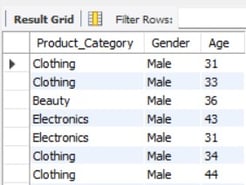
Then, I will start to count based on the age groups: below 30, between 31 and 49, and 50 and above, by selecting from the CTE. This can be little tedious but I created the CTE 3 times to handle each age group, this below is for the below 30 age group:
WITH store_demographics AS
(SELECT Product_Category, Gender, Age, Total_Amount
FROM retail_sales_dataset
WHERE Total_Amount >= 1500 ORDER BY Total_Amount DESC LIMIT 100)
SELECT Product_Category, Gender, Age
FROM store_demographics
WHERE Gender = 'Male' AND Age < '30';
And based on a limit of 100 purchases, our Males in the 31 to 49 age group frequents my store for high value purchases, more than the other age groups at a count of 22, but not far away from the 10+ customers of the other age groups.
And there goes another shift in strategy to reel in more customer of this age group, based on their purchasing habits.
To show appreciation to my customers, I will be distributing online vouchers for every category of customer spending, and it will be classified like this:
Premium for highest paying customers, from 1500 to 2000, Loyal for those in the middle, from 900 to 1400, and Valued for any purchase below 900.
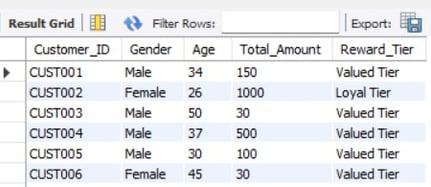
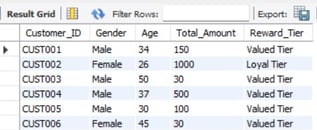
SELECT Customer_ID, Gender, Age, Total_Amount,
CASE
WHEN Total_Amount BETWEEN '1500' AND '2000' THEN 'Premium Tier'
WHEN Total_Amount BETWEEN '900' AND '1499' THEN 'Loyal Tier'
WHEN Total_Amount < '900' THEN 'Valued Tier'
END AS Reward_Tier
FROM retail_sales_dataset;
Now, I'll get to know who unlocked which reward tier for each transaction to enable me to effectively distribute the rewards amongst all of my customers.
All these are basic things I can do in MySQL to grab a set of data from a single table inserted into a database, and do some simple manipulation and data exploration. Will be striving to demonstrate more complex queries to retrieve data in the next post!